
Variable Gage R&R
Variable Gage Repeatability & Reproducibility (Gage R&R) is a method used to analyze the variability of a measurement system by partitioning the variation of the measurements using ANOVA (Analysis of Variance). Whenever something is measured repeatedly or by different people or processes, the results of the measurements will vary. Variation comes from two primary sources:
- Differences between the parts being measured
- The measurement system
We can use a Gage R&R to conduct a measurement system analysis to determine what portion of the variability comes from the parts and what portion comes from the measurement system. There are key study results that help us determine the components of variation within our measurement system.
Variable Gage R&R primarily addresses the precision aspect of a measurement system. It is a tool used to understand if a measurement system can repeat and reproduce and if not, help us determine what aspect of the measurement system is broken so that we can fix it.
Gage R&R requires a deliberate study with parts, appraisers and measurements. Measurement data must be collected and analyzed to determine if the measurement system is acceptable. Typically Variable Gage R&Rs are conducted by 3 appraisers measuring 10 samples 3 times each. Then, the results can be compared to determine where the variability is concentrated. The optimal result is for the measurement variability to be due to the parts.
What is Measurement System Analysis?
Measurement System Analysis (MSA) is a systematic method to identify and analyze the variation components of a measurement system. It is a mandatory step in any Six Sigma project to ensure the data are reliable before making any data-based decisions. A MSA is the check point of data quality before we start any further analysis and draw any conclusions from the data. Some good examples of data-based analysis where MSA should be a prerequisite:
- Correlation analysis
- Regression analysis
- Hypothesis testing
- Analysis of variance
- Design of experiments
- Statistical process control
You will see where and how the analysis techniques listed above are used. It is critical to know that any variation, anomalies, or trends found in your analysis are actually due to the data and not due to the inaccuracies or inadequacies of a measurement system. Therefore the need for a MSA is vital.
Measurement System
A measurement system is a process used to obtain data and quantify a part, product or process. Data obtained with a measurement device or measurement system are the observed values. Observed values are comprised of two elements
- True Value = Actual value of the measured part
- Measurement Error = Error introduced by the measurement system.
The true value is what we are ultimately trying to determine through the measurement system. It reflects the true measurement of the part or performance of the process.
Measurement error is the variation introduced by the measurement system. It is the bias or inaccuracy of the measurement device or measurement process.
The observed value is what the measurement system is telling us. It is the measured value obtained by the measurement system. Observed values are represented in various types of measures which can categorized into two primary types discrete and continuous. Continuous measurements are represented by measures of weight, height, money and other types of measures such as ratio measures. Discrete measures on the other hand are categorical such as Red/Yellow/Green, Yes/No or Ratings of 1–10 for example.
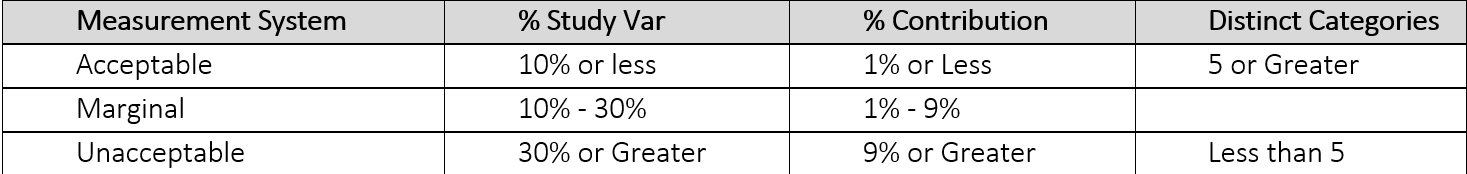
Variable Gage R&R Guidelines (AIAG)
The guidelines for acceptable or unacceptable measurement systems can vary depending on an organizations tolerance or appetite for risk. The common guidelines used for interpretation are published by the Automotive Industry Action Group (AIAG). These guidelines are considered standard for interpreting the results of a measurement system analysis using Variable Gage R&R. Table 1.0 summarizes the AIAG standards.
Use SigmaXL to Implement a Variable MSA
Data File: “Variable MSA” tab in “Sample Data.xlsx”
Let’s take a look at an example of a Variable MSA using the data in the Variable MSA tab in your “Sample Data.xlsx” file. In this exercise we will first walk through how to set up your study using SigmaXL and then we will perform a Variable MSA using 3 operators who all measured 10 parts three times each. The part numbers and operators and measurement trials are all generic so that you can apply the concept to your given industry. First we need to set up the study:
Step 1: Set up your data collection worksheet
- Click on SigmaXL -> Measurement Systems Analysis ->
Create Gauge R&R (Crossed) Worksheet - A new window named “Create Gauge R&R (Crossed) Worksheet” appears
- Enter 10 as the “Number of Parts/Samples”
- Enter 3 as the “Number of Operators/Appraisers”
- Enter 3 as the “Number of Replicates/Trials”
- Uncheck the checkboxes for both “Randomize Parts/Sample” and “Randomize Operators/Appraisers”
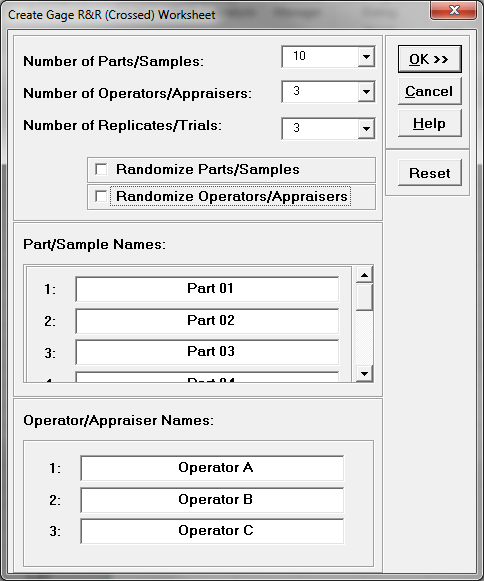
- Click “OK>>”
- A new tab named “Gage R&R (Crossed) WKS” is generated
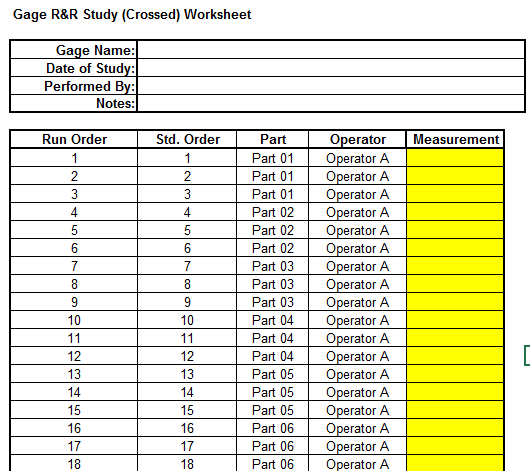
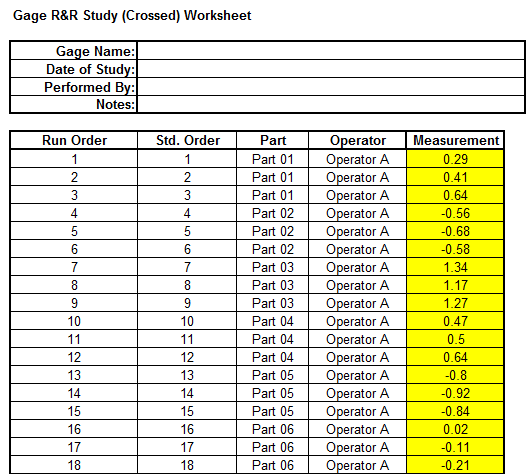
Step 2: Data collection
In the newly generated data table, SigmaXL has provided the template where we can organize the data. We will need to enter test results into the measurement column. In the “Sample Data.xlsx” file under the “Variable MSA” tab there are already “Measurement” values collected by the three operators (i.e., operator A, B, and C). The data are listed in Run order.
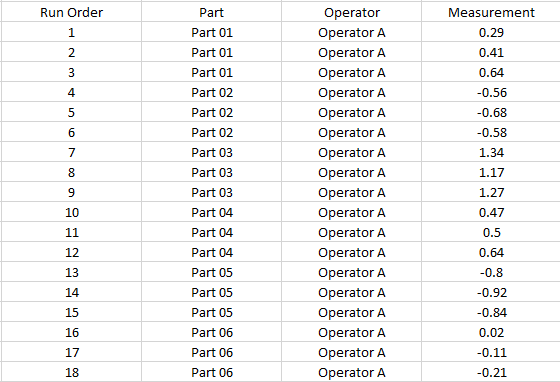 Step 3: Enter the data into the MSA template generated in SigmaXL
Transfer the data from the “Measurement” column in “Variable MSA” tab of “Sample Data.xlsx” file to the last column in the MSA template that SigmaXL generated from the steps above.
 Step 4: Implement Gage R&R
- Click SigmaXL -> Measurement Systems Analysis -> Analyze Gage R&R (Crossed)
- A new window named “Analyze Gage R&R (Crossed)” appears with the data range automatically selected in the box right below “Please select your data”
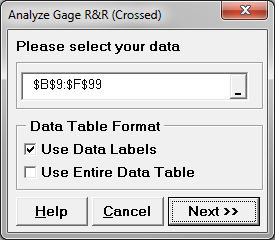
- Click “Next>>”
- A new window also named “Analyze Gauge R&R (Crossed)” pops up.
- Select “Part” as “Part”
Select “Operator” as “Operator”
Select “Measurement” as “Measurement” - Enter 5.15 as the “Standard Deviation Multiplier” and enter 95% as the “Confidence Level”.
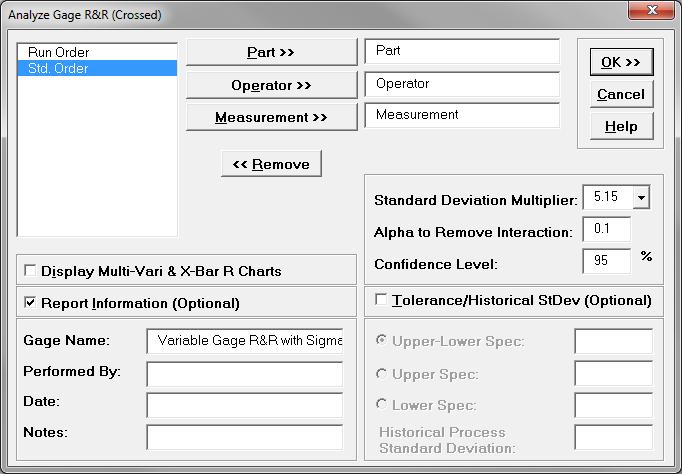
- Click “OK”
Step 5: Interpret the MSA results
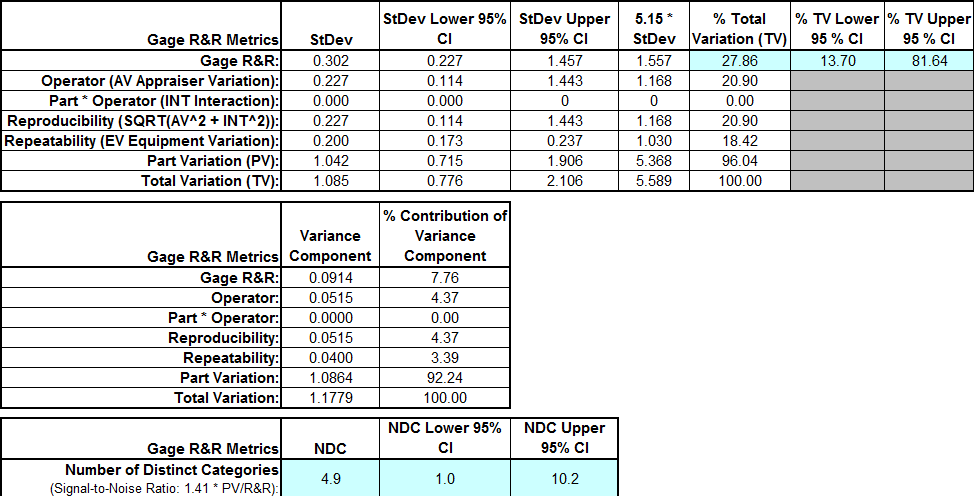
Model summary: The result of this Gage R&R study leaves room for consideration on one key measure. As noted in previous pages, the targeted percent contribution R&R should be less than 10% and study variation less than 30%. With % contribution at 7.76% it is below our 10% unacceptable threshold and similarly, Study variation at 26.86% is also below the threshold of 30% but this result is at best marginal and should be heavily scrutinized by the business before concluding that the measurement system does not warrant further improvement.
Comments are closed.