
What is Variable Gage R&R?
Whenever something is measured repeatedly or by different people or processes, the results of the measurements will vary. Variation comes from two primary sources:
- Differences between the parts being measured
- The measurement system
We can use a variable Gage R&R to conduct a measurement system analysis to determine what portion of the variability comes from the parts and what portion comes from the measurement system. There are key study results that help us determine the components of variation within our measurement system.
What is Measurement System Analysis?
Measurement System Analysis (MSA) is a systematic method to identify and analyze the variation components of a measurement system. It is a mandatory step in any Six Sigma project to ensure the data are reliable before making any data-based decisions. A MSA is the check point of data quality before we start any further analysis and draw any conclusions from the data. Some good examples of data-based analysis where MSA should be a prerequisite:
- Correlation analysis
- Regression analysis
- Hypothesis testing
- Analysis of variance
- Design of experiments
- Statistical process control
You will see where and how the analysis techniques listed above are used. It is critical to know that any variation, anomalies, or trends found in your analysis are actually due to the data and not due to the inaccuracies or inadequacies of a measurement system. Therefore the need for a MSA is vital.
Measurement System
A measurement system is a process used to obtain data and quantify a part, product or process. Data obtained with a measurement device or measurement system are the observed values. Observed values are comprised of two elements
- True Value = Actual value of the measured part
- Measurement Error = Error introduced by the measurement system.
The true value is what we are ultimately trying to determine through the measurement system. It reflects the true measurement of the part or performance of the process.
Measurement error is the variation introduced by the measurement system. It is the bias or inaccuracy of the measurement device or measurement process.
The observed value is what the measurement system is telling us. It is the measured value obtained by the measurement system. Observed values are represented in various types of measures which can categorized into two primary types discrete and continuous. Continuous measurements are represented by measures of weight, height, money and other types of measures such as ratio measures. Discrete measures on the other hand are categorical such as Red/Yellow/Green, Yes/No or Ratings of 1–10 for example.
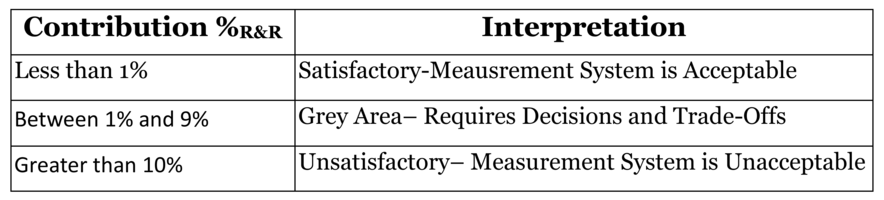
Variable Gage R&R Guidelines (AIAG)
The guidelines for acceptable or unacceptable measurement systems can vary depending on an organizations tolerance or appetite for risk. The common guidelines used for interpretation are published by the Automotive Industry Action Group (AIAG). These guidelines are considered standard for interpreting the results of a measurement system analysis using Variable Gage R&R. Table 1.0 summarizes the AIAG standards.
 Use Minitab to Implement a Variable MSA
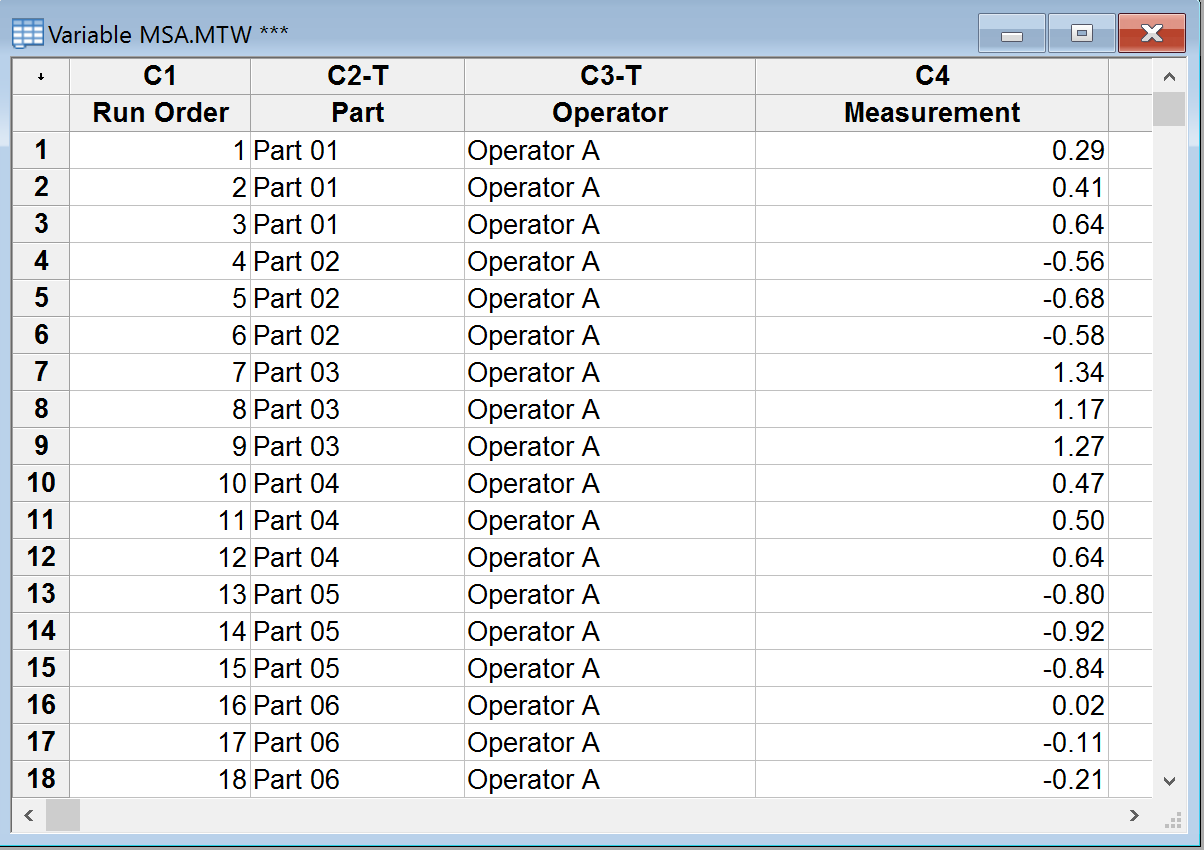
Data File: “Variable MSA” tab in “Sample Data.xlsx”
Let’s take a look at an example of a Variable MSA using the data in the Variable MSA tab in your “Sample Data.xlsx” file. In this exercise we will first walk through how to set up your study using Minitab and then we will perform a Variable Gage MSA using 3 operators who all measured 10 parts three times each. The part numbers and operators and measurement trials are all generic so that you can apply the concept to your given industry. First we need to set up the study:
- Click on Stat → Quality Tools → Gage R&R → Create Gage R&R Study Worksheet.
- A new window named “Create Gage R&R Study Worksheet” pops up.
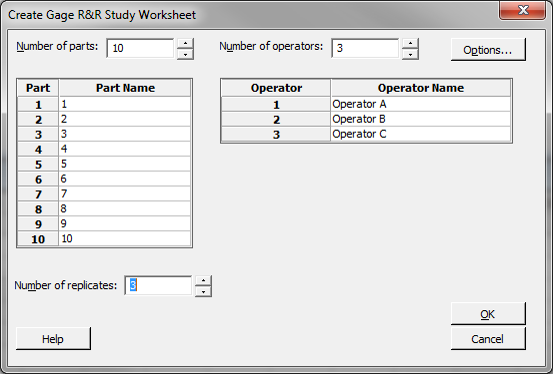
- Select 10 as the “Number of Parts.”
Select 3 as the “Number of Operators.”
Select 3 as the “Number of Replicates.”
Enter the part name (e.g., Part 01, Part 02, and Part 03).
Enter the operator name (e.g., Operator A, Operator B, Operator C).
Click on the “Options” button,
another window named “Create Gage R&R Study Worksheet – Options” pops up.
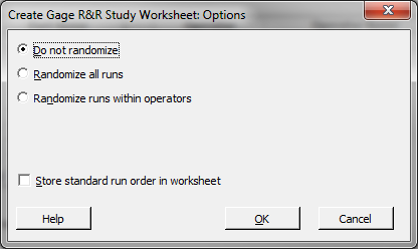
- Select the radio button “Do not randomize.”
- Click “OK” in the window “Create Gage R&R Study Worksheet – Options.”
- Click “OK’ in the window “Create Gage R&R Study Worksheet.”
- A new data table is generated.
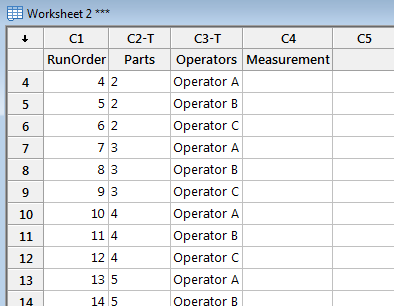
Step 2: Data collection
In the newly-generated data table, Minitab has provided the data layout for your data collection for your variable MSA study. We have added the header “Measurement” for this example. You would have to do something similar.
When you conduct your variable MSA in your work environment it would be necessary to set up your study just as we have in the previous steps and then you could collect your measurement data properly. However, for our purposes today, we have provided you with an MSA that is setup with data already collected. We will use our “Variable MSA” tab in “Sample Data.xlsx,” for the next steps.
Step 3: Activate the Minitab worksheet with our Variable MSA data prepopulated.
Step 4: Implement Gage R&R
- Click Stat → Quality Tools → Gage Study → Gage R&R Study (Crossed).
- A new window named “Gage R&R Study (Crossed)” appears.
- Select “Part” as “Part numbers.”
- Select “Operator” as “Operators.”
- Select “Measurement” as “Measurement data.”
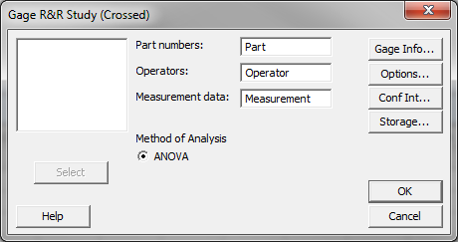
- Click on the “Options” button and another new window named “Gage R&R Study (Crossed) – ANOVA Options” pops up.
- Enter 5.15 as the “Study variation (number of standard deviations)”.
The value 5.15 is the recommended standard deviation multiplier by the Automotive Industry Action Group (AIAG). It corresponds to 99% of data in the normal distribution. If we use 6 as the standard deviation multiplier, it corresponds to 99.73% of the data in the normal distribution.
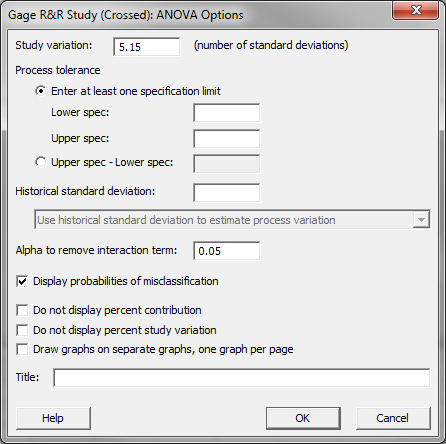
- Click “OK” in the window “Gage R&R Study (Crossed) – ANOVA Options.”
- Click “OK” in the window “Gage R&R Study (Crossed).”
- The MSA analysis results appear in the new window and the session window.
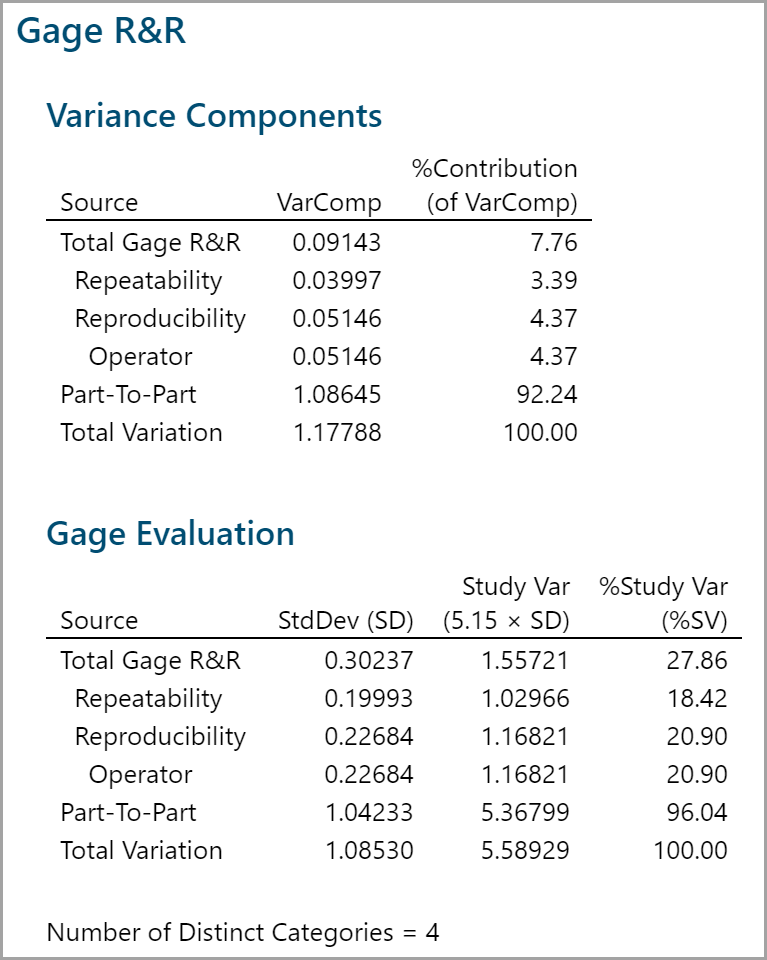
Step 5: Interpret the MSA results
The result of this Gage R&R study leaves room for consideration on one key measure. As noted in previous pages, the targeted percent contribution R&R should be less than 9% and study variation less than 30%. With % contribution at 7.76% it is below our 9% unacceptable threshold and similarly, Study variation at 26.86% is also below the threshold of 30% but this result is at best marginal and should be heavily scrutinized by the business before concluding that the measurement system does not warrant further improvement.
Visual evaluation of this measurement system is another effective method of evaluation but can at times be misleading without the statistics to support it. Diagnosing the mean plots above should help in the consideration of measurement system acceptability, you may benefit from taking a closer look at operator C.
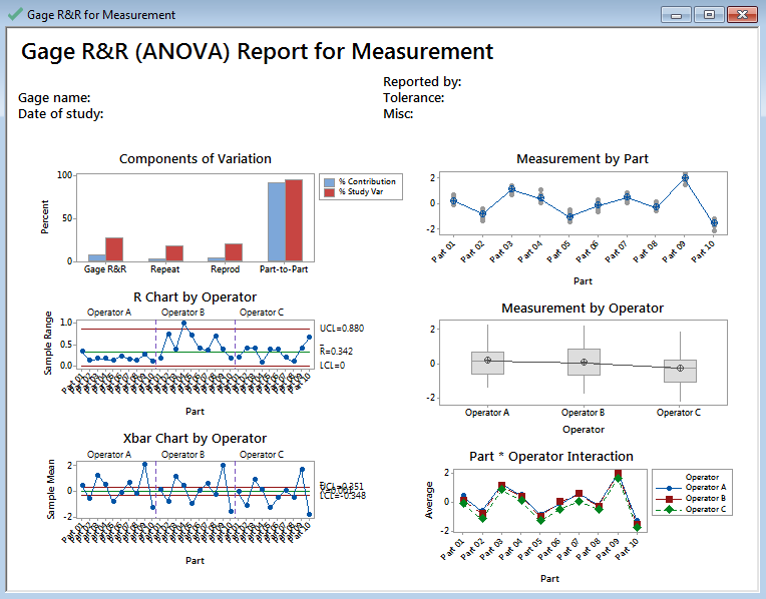
Model summary: Visual evaluation of this measurement system alone might mislead you to a conclusion of a passing gage study (most of the variation seems to be in part to part, which is what we hope to see). However, an experienced practitioner will note such things such as the range chart being out of control. This may help provide clues regarding what to look for when trying to further diagnose the validity of this measurement system. An out of control Range chart in a variable MSA suggests that an operator or all operators are too inconsistent in their repeated measures causing wide ranges and out of control conditions.
Whenever a range chart is out of control, the accuracy of the X chart is automatically called into question. You will learn in future lessons that the control limits of an X chart are calculated using the mean of the R chart. If the R chart shows out-of-control conditions, then the mean is likely misrepresented and any calculation using it should be questioned.
Comments are closed.