
Process Capability
Process capability measures how well the process performs to meet given specified outcome. It indicates the conformance of a process to meet given requirements or specifications. Capability analysis helps to better understand the performance of the process with respect to meeting customer’s specifications and identify the process improvement opportunities.
Process Capability Analysis Steps
- Determine the metric or parameter to measure and analyze.
- Collect the historical data for the parameter of interest.
- Prove the process is statistically stable (i.e. in control).
- Calculate the process capability indices.
Monitor the process and ensure it remains in control over time. Update the process capability indices if needed.
Process Capability Indices
Process capability can be presented using various indices depending on the nature of the process and the goal of the analysis. Popular process capability indices are:
- Cp
- Pp
- Cpk
- Ppk
- Cpm
The Cp index is process capability. It assumes the process mean is centered between the specification limits and essentially is the ratio of the distance between the specification limits to six process standard deviations. Obviously, the higher this value the better, because it means you can fit the process variation between the spec limits more easily. Cp measures the process’ potential capability to meet the two-sided specifications. It does not take the process average into consideration.
High Cp indicates the small spread of the process with respect to the spread of the customer specifications. Cp is recommended when the process is centered between the specification limits. Cp works when there are both upper and lower specification limits. The higher Cp the better, meaning the spread of the process is smaller relative to the spread of the specifications.
Note: Cpm can work only if there is a target value specified.
Use SigmaXL to Run a Process Capability Analysis
Data File: “Capability Analysis” tab in “Sample Data.xlsx”
Steps in SigmaXL to run a process capability analysis:
- Select the entire range of data (i.e. the column “HtBk”)
- Click SigmaXL -> Process Capability -> Histograms & Process Capability
- A new window named “Histogram & Process Cap” pops up with the selected range of data appearing in the box under “Please select your data”
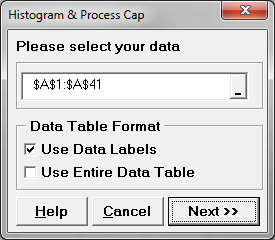
- Click “Next>>”
- A new window named “Histograms & Process Capability” appears
- Select “HtBk” as the “Numeric Data Variables”
- Enter 6 in LSL, 6.5 in T and 7 in USL into the boxes for “Lower Spec Limit”, “Target” and “Upper Spec Limit” respectively
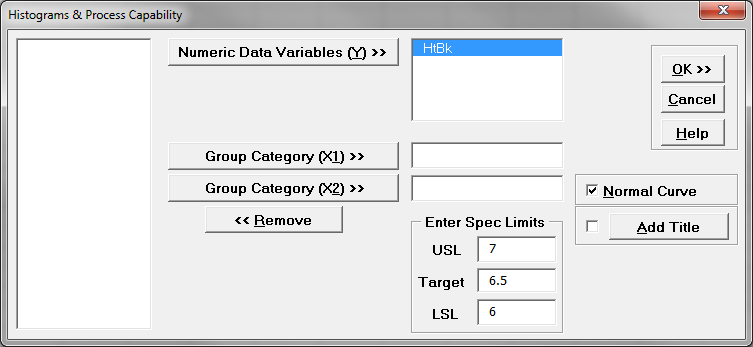
- Click “OK”
- The histogram and the process capability analysis results are in the newly generated tab “Hist Cap (1)”
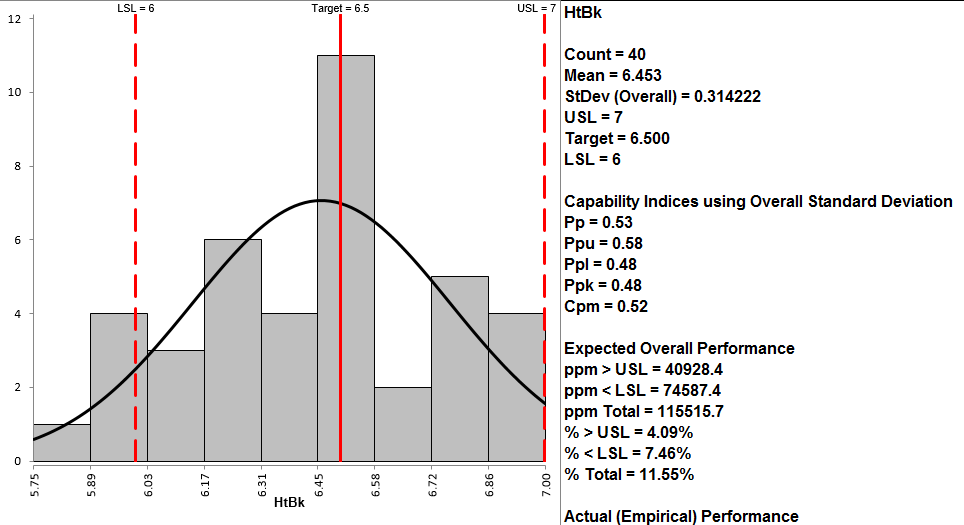
Model summary: With Ppk of less than 1.0 we can conclude that the capability of this process is not very good. Anything less than 1.0 should be considered not capable and we should strive for Ppk to reach levels of greater than 1 and preferably over 1.67.
Comments are closed.