
Use Minitab to Implement an Attribute MSA
Data File: “Attribute MSA” tab in “Sample Data.xlsx” (an example in the AIAG MSA Reference Manual, 3rd Edition).
Steps in Minitab to run an attribute MSA:
Step 1: Reorganize the original data into four new columns (i.e., Appraiser, Assessed Result, Part, and Reference).
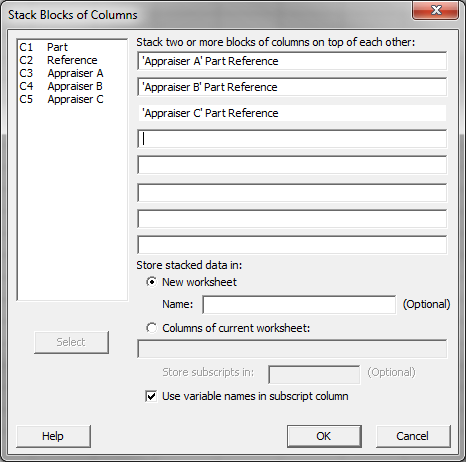
- Click Data → Stack → Blocks of Columns.
- A new window named “Stack Blocks of Columns” pops up.
- Select “Appraiser A,” “Part,” and “Reference” as block one.
- Select “Appraiser B,” “Part,” and “Reference” as block two.
- Select “Appraiser C,” “Part,” and “Reference” as block three.
- Select the radio button of “New worksheet” and name the sheet “Data.”
- Check the box “Use variable names in subscript column.”
- Click “OK.”
- The stacked columns are created in the new worksheet named “Data.”
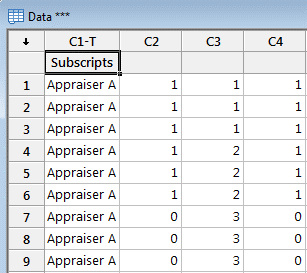
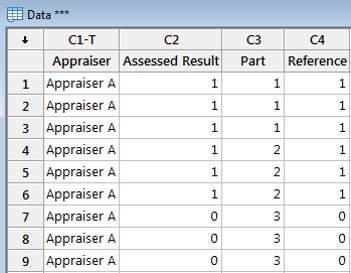
- Name the four columns from left to right in worksheet “Data”: Appraiser, Assessed Result, Part, and Reference.
Step 2: Run a MSA using Minitab
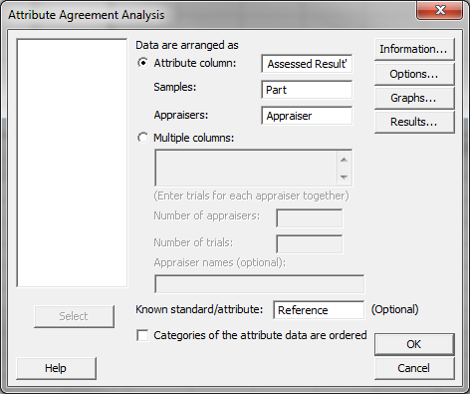
- Click Stat → Quality Tools → AttributeAgreement Analysis.
- A new window named “AttributeAgreement Analysis” pops up.
- Click in the blank box next to “Attributecolumn” and the variables appear in the list box on the left.
- Select “Assessed Result” as “Attribute”
- Select “Part” as “Sample.”
- Select “Appraiser” as “Appraisers.”
- Select “Reference” as “Known standard/attribute.”
- Click the “Options” button and another window named “AttributeAgreement Analysis – Options” pops up.
- Check the boxes of both “Calculate Cohen’s kappa if appropriate” and “Display disagreement table.”
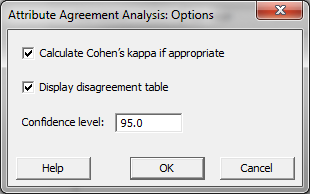
- Click “OK” in the window “AttributeAgreement Analysis – Options.”
- Click “OK” in the window “AttributeAgreement Analysis.”
- The MSA results appear in the newly-generated window and the session window.
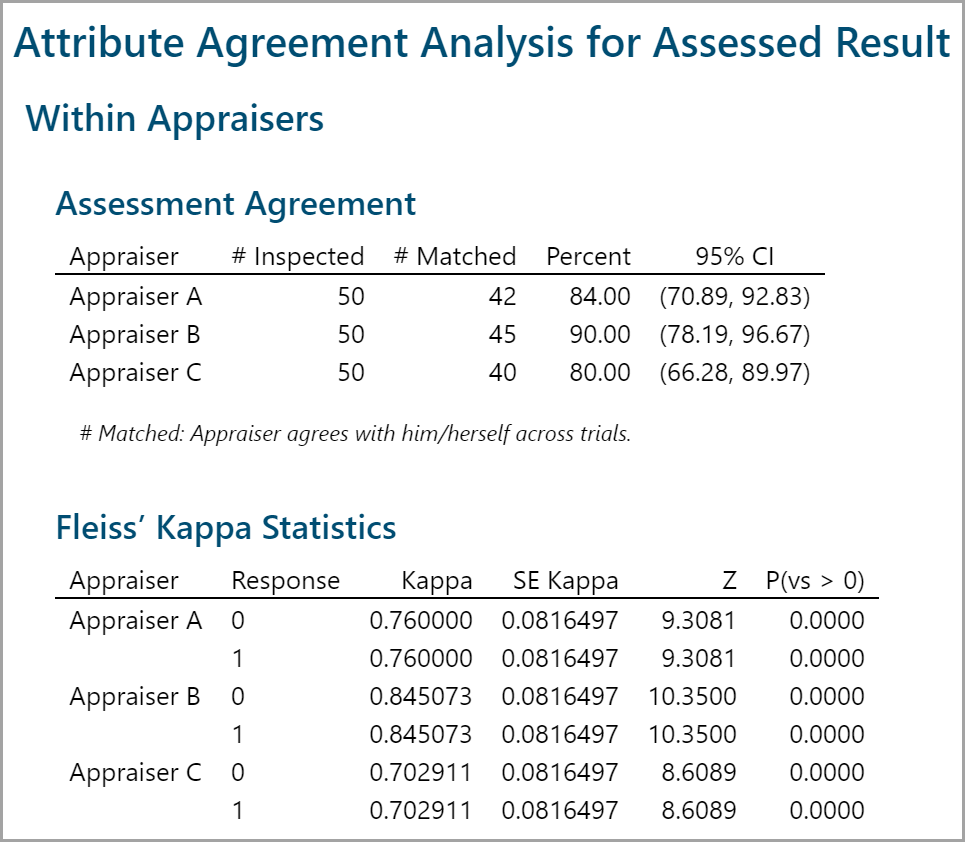
The rater scores represent how the raters agree with themselves. Appraiser A, for instance, agreed with himself on 84% of the measurements made.
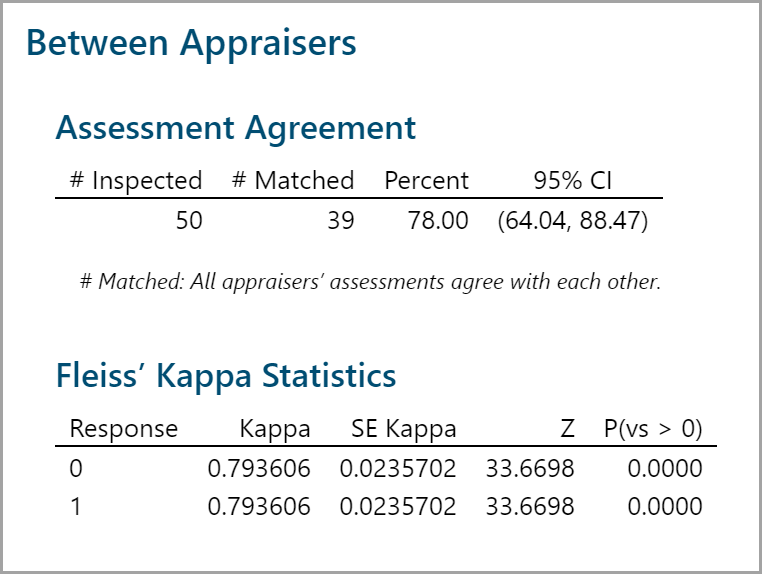
The important numbers are called out here. Of the 50 total measurements performed, for 78% of those (#39) the appraisers agreed with both themselves and the other appraisers.
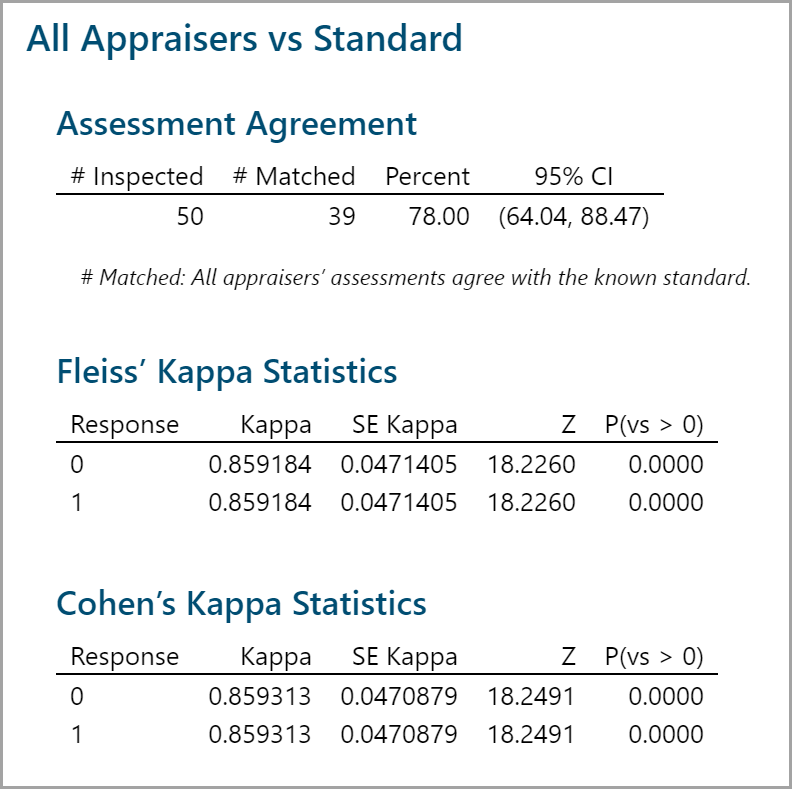
Kappa statistic is a coefficient indicating the agreement percentage above the expected agreement by chance. Kappa ranges from −1 (perfect disagreement) to 1 (perfect agreement). When the observed agreement is less than the chance agreement, Kappa is negative. When the observed agreement is greater than the chance agreement, Kappa is positive. Rule of thumb: If Kappa is greater than 0.7, the measurement system is acceptable. If Kappa is greater than 0.9, the measurement system is excellent.
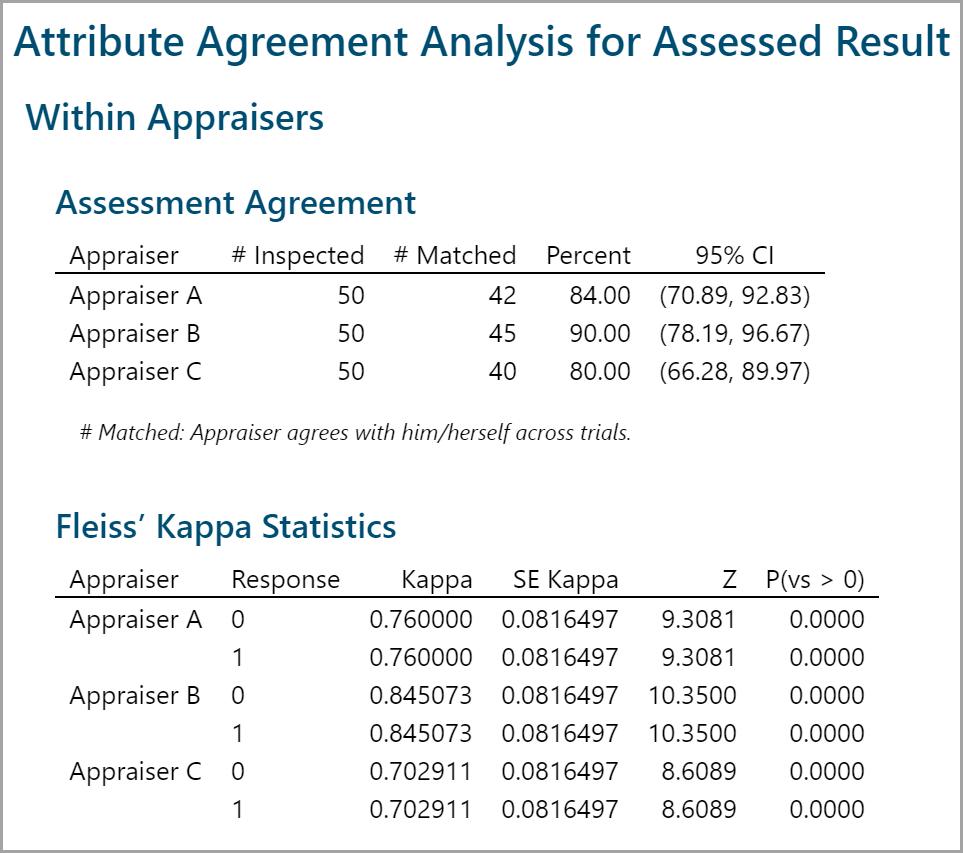
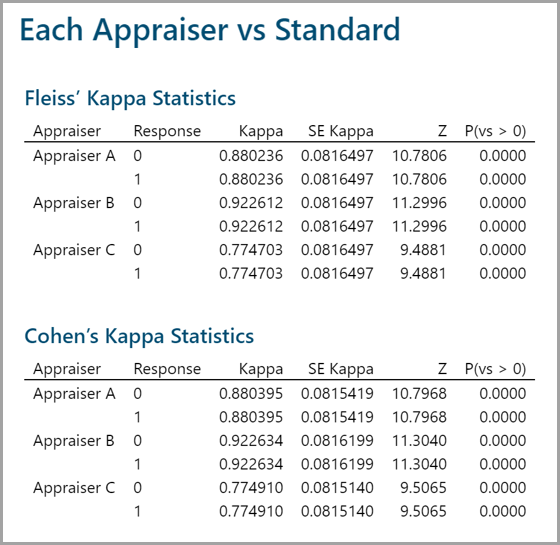
Model summary: In all cases the Kappa indicates that the measurement system is acceptable.
Comments are closed.