Process Capability Process capability measures how well the process performs to meet given specified outcome. It indicates the conformance of a process to meet given requirements or specifications. Capability analysis […]


Process Capability Process capability measures how well the process performs to meet given specified outcome. It indicates the conformance of a process to meet given requirements or specifications. Capability analysis […]

Use SigmaXL to Implement an Attribute MSA Data File: “Attribute MSA” tab in “Sample Data.xlsx” (an example in the AIAG MSA Reference Manual, 3rd Edition). Step 1: Reorganize the original […]

Variable Gage R&R Variable Gage Repeatability & Reproducibility (Gage R&R) is a method used to analyze the variability of a measurement system by partitioning the variation of the measurements using […]

Why we use a Run Chart A run chart is a chart used to present data in time order. These charts capture process performance over time. The X axis indicates time and […]

What is a Scatter Plot A scatter plot is a diagram to present the relationship between two variables of a data set. It consists of a set of data points set […]

What is a Histogram? A histogram is a graphical tool to present the distribution of the data. These plots are used to better understand how values occur in a given set of […]

What is a Box Plot? In statistics, graphical analysis is a method to visualize the quantitative data. Graphical analysis is used to discover structure and patterns in the data. The […]
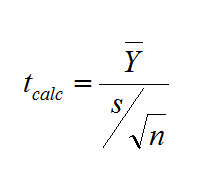
What is a One Sample t Test? A One sample t test is a hypothesis test to study whether there is a statistically significant difference between a population mean and […]

Central Limit Theorem The Central Limit Theorem is one of the fundamental theorems of probability theory. It states a condition under which the mean of a large number of independent […]

Multi-Vari Analysis Multi Vari Analysis is a graphic-driven method to analyze the effects of categorical inputs on a continuous output. It studies how the variation in the output changes across […]

Kruskal–Wallis One-Way Analysis of Variance The Kruskal Wallis one-way analysis of variance is a statistical hypothesis test to compare the medians among more than two groups. It is an extension […]
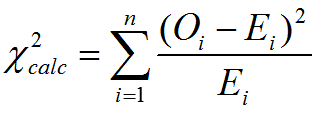
Chi Square (Contingency Tables) We have looked at hypothesis tests to analyze the proportion of one population vs. a specified value, and the proportions of two populations, but what do […]
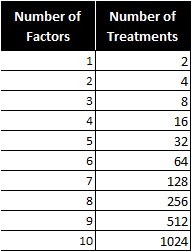
This content is for Subscribers Users

This content is for Subscribers Users

This content is for Subscribers Users
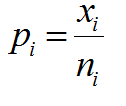
This content is for Subscribers Users

This content is for Subscribers Users
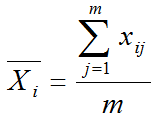
This content is for Subscribers Users
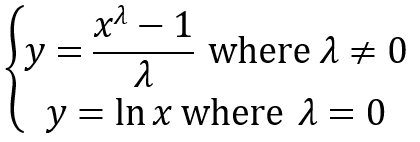
This content is for Subscribers Users

This content is for Subscribers Users
